A rare “blob” of unusually warm water that did massive damage to California’s marine life has reemerged

Article By: Kelsey Kennedy

While this year’s El Niño wasn’t as bad as meteorologists were expecting, there’s something else wreaking havoc on North America’s marine ecosystems: a huge mass of warm water off the Pacific Coast nicknamed by University of Washington meteorologist Nick Bond “the blob.”

It’s not a creature from a horror flick, but it might as well be for marine scientists. The blob was 1st noticed on the surface of the Pacific in 2013 & some weather experts declared it dead last December. But the blob isn’t dead — it’s just retreated to deeper parts of the ocean, according to recent findings. The Canadian Coast Guard regularly measures the ocean’s temperature at different depths off the coast of British Columbia & found that rather than sitting at the surface of the water, the blob is now hovering between 150 & 200 meters (about 500 to 650 feet) below.

“The residual effect of the blob is still there,” Canadian scientist Ian Perry told CBC News this week.

The blob’s effects have been anything but benign, according to a new study, published Wednesday in the journal Geophysical Research Letters by a team of researchers from the University of California, Santa Cruz, Scripps Institution of Oceanography & the National Oceanic & Atmospheric Administration. The study presents evidence that the blob was responsible for more ecosystem damage off the California coast, including depleted marine food sources & disrupted migration patterns, than the 2015-2016 El Niño weather system.

Scientists aren’t quite sure how the blob developed. It isn’t a result of El Niño, or another ocean cycle called the Pacific Decadal Oscillation, which is a pattern of oceanic warming & cooling that occurs on a much larger timescale than other weather patters. What they do know is that its timing with El Niño wasn’t great. While El Niño was weaker along the California coast than meteorologists predicted, it worked in tandem w/the blob.

“In their wake lies a heavily disrupted ecosystem,” study author Michael Jacox said in a press release.

The plankton population in Californian waters took less of a hit than during El Niños past, but the researchers suggest the blob may lead to lower plankton numbers for a longer period of time. These microscopic organisms that float in the ocean water are critical for the health of marine ecosystems. They photosynthesize & add oxygen to the water & they’re an important food source for many fish & whales.

Fewer plankton isn’t the only sign of trouble. Crabs that normally live in the open ocean washed up on California beaches last year & sightings of humpback whales have been reported much closer to shore than usual.

As for the future of the blob, it seems an upcoming La Niña might deliver the fatal blow, bringing the warm water back down to a reasonable temperature. Nick Bond told CBC News this week that bc the blob is so warm, cooling down is:

“going to take a while — at least through the remainder of this year.”

View full article at: http://qz.com/727349/a-rare-blob-of-unusually-warm-water-that-did-massive-damage-to-californias-marine-life-has-reemerged/

Why is it so insanely hot in India right now?

Article By: Sarah Perkins-Kirkpatrick, Andrew King & Geert Jan van Oldenborgh

india-heat-wave

On May 19, India’s all-time temperature record was smashed in the northern city of Phalodi in the state of Rajasthan. Temperatures soared to 51℃, beating the previous record set in 1956 by 0.4℃.

India is known for its unbearable conditions at this time of year, just before the monsoon takes hold. Temperatures in the high 30s are routine, w/local authorities declaring heatwave conditions only once thermometers reach a stifling 45℃. But the record comes on the back of an exceptionally hot season w/several heatwaves earlier in the year. So what’s to blame for these scorching conditions?

Much of India is in the grip of a massive drought. Water resources are scarce across the country. Dry conditions exacerbate extreme temperatures bc the heat energy usually taken up by evaporation heats the air instead. The complex relationship between droughts & heatwaves is an area of active scientific research, although we know a preceding drought can significantly amplify the intensity & duration of heatwaves.

India’s drought was a possible factor in the earlier heatwaves in April over central & southern India. However, Rajasthan, where 51℃ was recorded, is always bone-dry in May. So the drought made no difference to the record temperature.
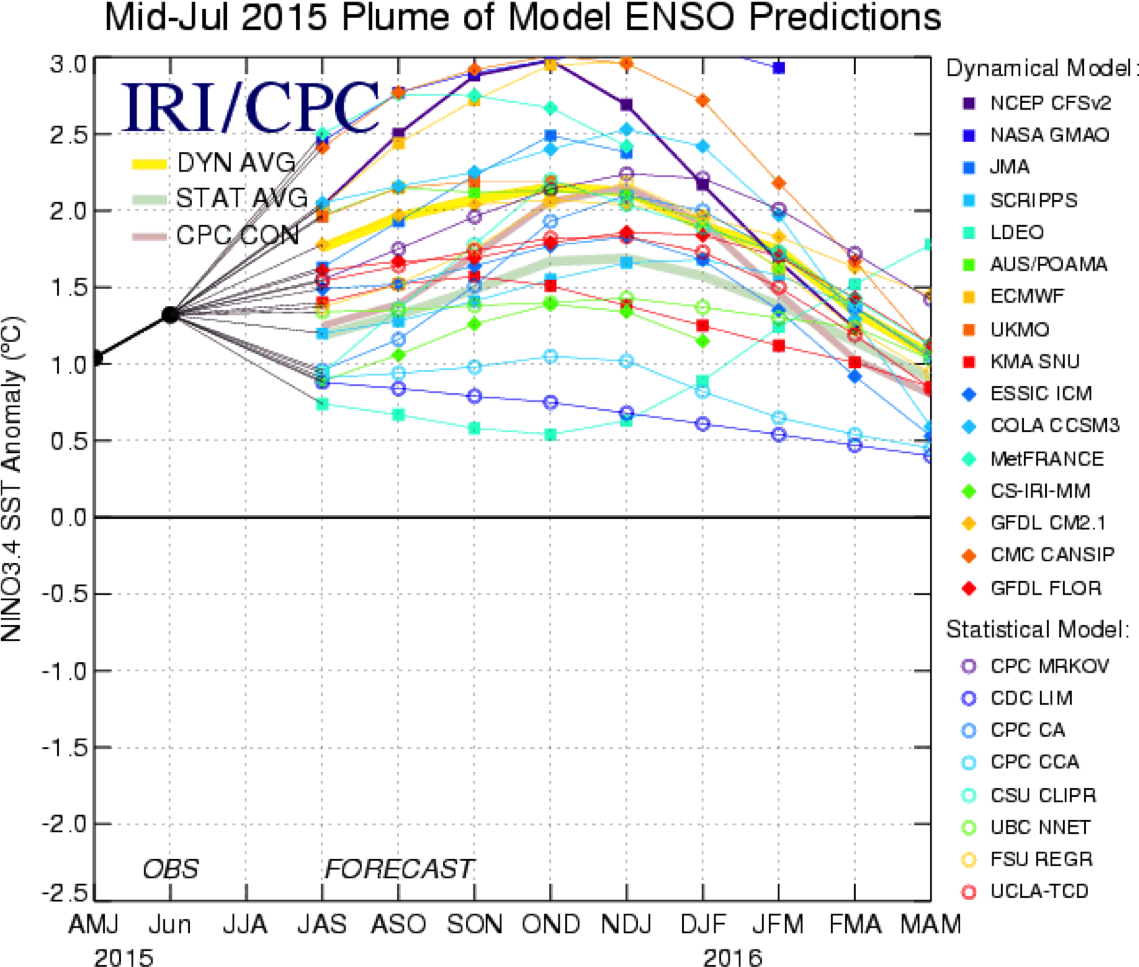
The El Niño effect
We have also experienced 1 of the strongest El Niño events on record. While the current event has recently ceased, its sting is certainly still being felt.
El Niño episodes are associated w/higher-than-average global temperatures & have also been a factor in some of India’s past heatwaves. However, there is no direct connection to El Niño in Rajasthan bc its climate at this time of year is so dry anyway.

India also has an extreme air pollution problem. Caused largely by domestic fuel & wood burning, it kills up to 400,000 people every year. This pollution, made up of fine particles called aerosols, also has the effect of cooling the local climate by reflecting or absorbing sunlight before it reaches the ground, thus reducing the likelihood of the most extreme high temperatures. So although India is no stranger to extreme heat at this time of year, the smog has kept record-breaking high temperatures at bay — until now. This is what makes the record in Phalodi remarkable.

Longer-term heat extremes
A study published in 2013 analysed annual trends in extremes & found no significant change in the intensity of extreme Indian temperatures between 1951 & 2010. The high levels of local air pollution were probably behind the lack of change. However, the study found a significant increase in the frequency of extreme temperatures & a remarkable trend in the duration of warm spells in India, as the map below shows. Warm spells, defined as at least 6 days of extreme temperatures relative to the location & time of year, increased by at least 3 days per decade over 1951-2010 – the largest trend recorded globally.heat-map.jpg
Global trends in ‘warm spell duration index’, which shows that the duration of heatwaves in India has increased markedly relative to the 1961-90 average. Data are also available via http://www.climdex.org.(Journal of Geophysical Research)

It is worth keeping in mind that these trends are annual & are influenced by extremes all year round. However, monthly trends in the frequency of Indian temperature extremes for May, which can be found on the CLIMDEX climate database, show an increase over the past 60 years. Based on local station data, the India Meteorological Department reported that many northern states experienced an average of 8 heatwave days each March-July between 1961-2010. Trends in “normal” & “severe” heatwaves increased over this time, & in particular over the last decade of the analysis.

Some Indian regions also tended towards longer & more intense heatwaves after an El Niño, & northwestern states of India, where Phalodi is located, tend to experience more intense events anyway. Trends in the intensity of extreme temperatures are less clear & vary across the country. Different spatial & temporal scales & methods of quantifying extreme temperature hamper a direct comparison of the 2 studies described above. However, they both document an increase in the frequency of extreme temperatures over India, which is consistent w/many other regions worldwide. Heatwave indices & the hottest yearly temperature have only increased significantly in a relatively small region of western India.

What will the future bring?
Most climate models do not do a great job of capturing observed trends in heatwaves over India bc large-scale models struggle to accurately represent the localized effect of aerosols. It is, therefore, difficult to use them in great detail for future projections, particularly if pollution levels continue or even increase. However, if air pollution is reduced, temperatures will rise with a vengeance. We know this from experience over Europe, where summer temperature trends were virtually 0 up to the 1980s & very strong afterwards, once air pollution was controlled.

Even though this is the hottest time of the year for the region, the recent weather should not be dismissed as regular. It is feasible that India’s pollution problem has been “hiding” extreme heat spikes. While any clean-up activities will have many positive local health impacts, these are likely to cause more intense heatwaves in future. This will be amplified by background warming due to climate change, which is also likely to drive increases in the frequency of temperature extremes.

Last year India and neighbouring Pakistan suffered similarly atrocious conditions, killing 1000s of people. This year’s death toll is already over 1,000, w/numbers sure to rise further.

India is already highly vulnerable to the health impacts of oppressive heatwaves & as climate change continues, this vulnerability will grow. It is, therefore, imperative that heat plans are put in place to protect the population. That’s a difficult prospect in places that lack communications infrastructure or widespread access to air conditioning. In the longer term, this episode shows that the global warming targets agreed in Paris have to be taken seriously, so that unprecedented heatwaves & their deadly impacts don’t become unmanageable in this part of the world.

View full article at: http://qz.com/695157/why-is-it-so-insanely-hot-in-india-right-now/

This month could be hottest February in 95 years across Southern California

Article By: David Montero, LA Daily News

It’s not your imagination. This February has been excessively warm. Perhaps you thought the promise of El Niño would keep it cool & that its fizzle is what made it sizzle. Putting on the air conditioning, putting on the sunscreen & putting up w/the heat. When did winter become the new summer, anyway? This year, it would appear.AR-160229730National Weather Service data show February 2016 is on the verge of entering the record books as the hottest February in 95 years in Los Angeles. W/just 5 days left in the month, the average daily temperature for February is 65 degrees. Currently, the record holder is 1995, when the average temperature was 65.3 degrees. But w/the forecast for the next 5 days set to average 69.1 degrees, that 1995 number could be in jeopardy.

Stuart Seto of the National Weather Service said several high-pressure ridges this month — along w/air flows coming from the mountains — have kept the temperatures much higher than normal. Those high-pressure ridges had you feeling the heat from Riverside to Reseda.

“And we’re expecting higher-than-normal temperatures for the rest of the week,” Seto said.

Only 3 years in the past 95 years of National Weather Service data show the average daily temperature for February eclipsing 64 degrees. Those years were 1980 (64.6 degrees), 1981 (64.3 degrees) & last year (64.1 degrees). 2 years — 1954 & 1982 — had average February temperatures of 64 degrees. The coolest February was in 1949, when the average temperature was 52.7 degrees.

Whether the weather for February ends up being the new record holder — barring a bizarre cooling trend — the month has already seen a record high of 90 degrees set at USC in the middle of the month. And the Big Bear Winter Festival, originally scheduled for Saturday & Sunday announced this week it was postponing its snowshoeing & fatbike races to March 12-13.

Big Bear Cycling President & Big Bear Winter Festival Chairman Craig Smith said in a statement they were hopeful for a change in weather patterns before the new dates.

“This was planned as a snow event from the beginning,” Smith said. “We are not going to run the event in non-snowy conditions.”

Mountain High is also starting its spring prices for skiers & snowboarders beginning March 1, more than 2 weeks before spring actually hits.

By the way, last year had the warmest March on record, w/an average temperature of 68.2 degrees. That shattered the previous record for the warmest March, 1 that had stood since 1931.

View full article at: http://www.dailynews.com/general-news/20160224/this-month-could-be-hottest-february-in-95-years-across-southern-california

When asked if coming Godzilla of an El Nino will wreak havoc on us…

Post By: Albert Mascheroni

I was asked if this Godzilla of an El Nino will wreak havoc on us. This was my response –

11237223_469044813275204_3424651899314323032_o

I don’t know. But I will ask. I know that if this happens these waters will overturn the earth (Job 12:15) & with 100% certainty, it will not alleviate our drought, but only make matters worse. In dreams I’ve seen the water rationed, I saw people trading work for water, I was told that our water supply is down to a mere puddle unbeknownst to the people. In another dream I was caught up in a tornado & was told that this is prelude before they start deceiving people w/signs & wonders; witchcraft.

I’ve seen a lot more, but not this storm so w/certainty I can’t tell you, unless I am shown in which case, I will get back to you. But of the rest I just mentioned, I am sure w/out a single doubt it will happen as was shown to me. Also I’ve seen people leave their homes & ask for food, but as I was shown, I can’t help unless otherwise told. I think this might be bc I warned the people, & they chose to blow me off, so when the time comes they will know. In that specific dream after I was asked for food I observed there were no women, only men left. In my dream I felt the men killed off the weaker women (but I can’t confirm seeing this, just feeling it & seeing there were no women). Then I saw the man that asked me for food return to his home & get into a pod; however I couldn’t interpret the pod & why? The pod was see-through shaped like an empanada or a chicken dumpling only in human size. He got in then sealed it after he left me & returned empty handed. I figure the pod will eventually make sense to me but as of now it does not.matrix_pod-1

Related article: Italian Designers Devise Burial Pods to Turn Human Remains into Trees [http://www.ndtv.com/world-news/italian-designers-devise-burial-pods-to-turn-human-remains-into-trees-743436]12248174_469044806608538_4819653243448624924_o

I will ask about this forecasted storm; but I don’t usually ask. I’ve asked about the mark & the process & was given a response. Since then, everything I’ve gotten has been given to me w/out asking so I’ve shared a lot of what I know w/everyone here, w/the exception of dreams detailed to me & me only. Although, I’ve shared some of them too.

We are challenged to ask…

Thus saith the LORD, the Holy One of Israel, and his Maker, Ask me of things to come concerning my sons, and concerning the work of my hands command ye me. – Isaiah 45:11

But I have not been so bold, neither do I feel I deserve these visions & dreams bc I sin & I have not done what has been commanded I do.

And why call ye me, Lord, Lord, and do not the things which I say? – Luke6:46

I feel that the ONLY reason I am given what I am given is bc God knows I will share it w/you & fight for you until my last breath.

Therefore say unto the house of Israel, Thus saith the Lord GOD; I do not this for your sakes, O house of Israel, but for mine holy name’s sake, which ye have profaned among the heathen, whither ye went. – Ezekiel 36:22

Surely the Lord GOD will do nothing, but he revealeth his secret unto his servants the prophets. – Amos 3:7

Do I deserve this? Absolutely NOT! I am ashamed to even raise my head to the sky.

The Lord GOD does this for your sake & for His holy name’s sake, bc I know for certain I am not deserving of it! I can see signs, read #s, sense things, smell things (I can smell death before it happens), I can read everything & anything between the lines (that are not of this world), but it is for you that I can; for us.

Albert Einstein — ‘Those who have the privilege to know have the duty to act.’

Will I die a thousand painful deaths in the name of Christ? Certainly I would, as I have already been tested. Can I die for my friends? Certainly I can, as I have already been tested. But who can say they truly live for Christ? I shamefully cannot. I have been stripped of everything but still I try & hang on, keeping 1 foot in this world & the other out of this world.

And the publican, standing afar off, would not lift up so much as his eyes unto heaven, but smote upon his breast, saying, God be merciful to me a sinner. – Luke 18:13

If ye love me, keep my commandments. – John 14:15

I told someone that we’re in the same boat —

Who is weak, and I do not feel weak? Who is led into sin, and I do not inwardly burn? – 2 Corinthians 11:29

Her response – Your boat is bigger.

This person is right. Am I waiting for push comes to shove? Will it be too late? My self-reflection should also be your self-reflection. Yes my boat is bigger, but shouldn’t you also want to get on this boat before it sails away? Bc we’re currently on 1 that is sinking w/no way of preventing it from sinking. No way to plug the current damage (although they tell you, that we must fight for climate change & curb our carbon footprints — but nothing will work except you save your souls & repent. I’ve seen what happens next.

So likewise ye, when ye shall see all these things, know that it is near, even at the doors. – Matthew 24:33

View full post at: https://www.facebook.com/al.masch.50/posts/469044879941864

‘Are the record temperatures due to climate change or due to El Nino?’ 2015 set to become hottest year ever

Article By: National Post


An El Nino in the Pacific Ocean & rising temperatures caused by climate change have put the world on an almost irreversible path to its warmest year on records dating back to 1880. Global temperatures from January to August were 1.5 degrees Fahrenheit (0.8 Celsius) above the 20th-century average & the warmest 1st 8 months of any year in the books, the U.S. National Centers for Environmental Information said in a monthly climate report.

“Are the record temperatures due to climate change or due to El Nino? The answer is yes,” said Deke Arndt, chief of the center’s monitoring branch in Asheville, North Carolina. “Long- term climate change is like climbing a flight of stairs. El Nino is like standing on tippy toes while you are on 1 of those stairs.”


This June 19, 2015 aerial photo shows a white heron taking flight over revealed fish nests, normally inches below the waterline in La Plata reservoir in Toa Alta, Puerto Rico. Thanks to El Nino, a warming of the tropical Pacific Ocean that affects global weather, less rain fell to help refill the reservoir, as well as La Plata river.

The world is so warm that only a major reversal of temperatures will keep 2015 from surpassing last year as the warmest year on record. Before August’s data was tabulated, the world had a 97% chance of setting a new high, Ardnt said.

“Adding August to that will raise those odds,” he said Thursday on a conference call with reporters.

Through every month of the year, 2015’s temperature anomalies have outpaced each of the previous 5 warmest years on record. That includes 1998, when the world experienced a powerful El Nino.

In this July 1, 2015 photo, Tree Dunlap stands behind the family’s dry well in their community of Okieville, on the outskirts of Tulare, Calif. Since the well dried up, the Dunlap family has been forced to find water elsewhere, including applying for programs that provide bottled water.

“8 months through a 12-lap race, & you can see the lead it has on its competitors,” Ardnt said.

Last month also was the warmest August on record, w/temperatures rising to 1.58 degrees above the 20th century average. It was the 6th month this year that broke its own record. In the U.S., there is a growing chance above-normal temperatures will persist in Alaska & along the West Coast, as well as in the upper Midwest & Northeast, through February. That’s in line w/what can happen during a strong El Nino, said Dan Collins, a research scientist at the U.S. Climate Prediction Center in College Park, Maryland.

Drought conditions have many Alberta ranchers concerned. Warmer temperatures in the mountains of California can affect snowpack there. The snow is needed to provide the state, now in its 4th year of drought, w/water throughout the year.

“It is not a clear picture as to whether or not there will be snowpack,” Collins said.

As part of Thursday’s report, the U.S. predicted drought will persist across most of California into December. There is a chance conditions will improve in the southern part of the state even if the drought doesn’t end there. In the Arctic, the sea ice dropped to 22.3% below the 1981-2010 average, according to the report. That’s was the 4th-smallest for August since records began in 1979. The Antarctic, which had been seeing large sea-ice growth in its winter months in past years, also had a below-average total.

The lack of sea ice in the Arctic will probably keep temperatures warmer than normal across Alaska & lead to more precipitation there in months to come, the report said.

View full article at: http://news.nationalpost.com/news/world/are-the-record-temperatures-due-to-climate-change-or-due-to-el-nino-2015-set-to-become-hottest-year-ever

El Niño intensifying, could rival strongest in recorded history

Article By: Jason Samenow

The present El Niño event, on the cusp of attaining “strong” intensity, has a chance to become the most powerful on record. The event — defined by the expanding, deepening pool of warmer-than-normal ocean water in the tropical Pacific — has steadily grown stronger since the spring.

The presence of a strong El Niño almost ensures that 2015 will become the warmest on record for Earth & will have ripple effects on weather patterns all over the world. A strong El Niño event would likely lead to enhanced rainfall in California this fall & winter, a quieter than normal Atlantic hurricane season, a warmer than normal winter over large parts of the U.S., & a very active hurricane & typhoon season in the Pacific. Some of these El Niño-related effects have already manifested themselves &, over the U.S., will become particularly apparent by the fall & winter.

Frequent & persistent bursts of wind from the west, counter to the prevailing easterly direction, have helped this year’s El Niño sustain itself & grow. Warm water from the western Pacific has sloshed eastward, piling up in the central & eastern part of the basin. The sprawling area of warm waters has proven to be a boon for Pacific tropical cyclone activity, near record levels through mid-summer. Through a positive feedback mechanism, these cyclones have likely helped to reinforce the westerly push of warm waters, Slate’s Eric Holthaus reported.

The 2015 El Niño event is now neck-&-neck w/record-setting event of 1997-1998 in terms of its mid-summer intensity.
That 1997-1998 event was notorious for its winter flash floods & mudslides in California.

Michael Ventrice, a meteorologist for the Weather Company, said the atmospheric footprint of this year’s event — given the time of year — is statistically extremely rare & has a less than 1 in 1,000 chance of occurrence:

Although the El Niño is still officially classified as a “moderate” strength event, Tony Barnston, 1 of the world’s leading El Niño experts, explained it could well become a “strong” event by the end of the month.

“The strength of the departure from normal sea surface temperatures was enough to call it a strong event for just last week,” Barnston, of Columbia’s International Research Institute for Climate & Society (IRI), said. “But to call it an officially strong event, we need for it to stay at that level or higher for a full month. & the average for July could make it.”

The large group of El Niño models, both dynamic (based on physical processes) & statistical (based historical data), mostly forecast at least a strong event — likely to peak in the fall. Collectively, the IRI described the model simulations as “off-the-charts”:

“[El Niño] is growing & the prediction models say it’s going to get stronger,” Barnston said. “& that’s our prediction, that it will become a strong event, most likely.”

A few models, notably the European model & the National Weather Service CFS model, point to the possibility of a near-record event in which a very strong or “super” El Niño develops.
 The only 2 super (or very strong) El Ninos in the historic record occurred in 1982-83 & 1997-98. Perhaps hinting at an El Niño rivaling history, models have been trending stronger w/their forecast month after month after month — as they absorb more data reflecting the true state of the current event & how it’s evolving:

While some models show El Niño possibly maxing out in record territory, NOAA climate analyst Michelle L’Heureux expressed some skepticism about such projections in an interview w/Mashable’s Andrew Freedman.

“L’Heureux noted that none of the major forecasting centers responsible for monitoring El Nino are predicting a record event at this time,” Freedman reported.

NOAA says the “forecaster consensus” is for a strong event but doesn’t specify how strong. Its forecast calls for El Niño to persist through the winter (90% chance) & early spring (80% chance).

View full article at: http://www.washingtonpost.com/blogs/capital-weather-gang/wp/2015/07/20/el-nino-intensifying-could-rival-strongest-in-history/

This year Earth is off to warmest start in at least 136 years

Article By: Andrew Freedman

Earth has had a remarkably hot 1st quarter of the year, w/the January through March period coming in as the warmest such period on record, according to information released Friday. Data from the National Oceanic & Atmospheric Administration (NOAA) confirms information from NASA & the Japan Meteorological Agency (JMA), which indicated that 2015 was off to an unusually toasty start.

According to NOAA, March was the warmest such month on record, at 1.53 degrees Fahrenheit above the 20th century average, beating out 2010 by 0.09 degrees Fahrenheit. The JMA also found March was the warmest such month in its database, whereas NASA ranked the month in 3rd place. Each center uses different methods to gather & analyze global temperature information, resulting in different rankings.

Using the NOAA’s data, 7 of the past 11 months — May, June, August, September, October & December 2014, as well as March 2015, have tied or set new record-high monthly temperatures.

The NOAA found that March was not only record warm, but the amount by which the monthly average temperature exceeded previous such months was itself noteworthy. According to NOAA, the March 2015 global temperature was the 3rd-highest monthly departure from average on record for any month, coming in just 0.02 degrees Fahrenheit lower than the anomalies for February 1998 & January 2007.

The 1st quarter of 2015 was the warmest such period on record across the world’s land & ocean surfaces, at 1.48 degrees Fahrenheit above the 20th-century average; this beat the previous record set in 2002 by 0.09 degrees Fahrenheit. The average global land-surface temperature for the 1st quarter of 2015 was the warmest on record, whereas global ocean temperatures were the 3rd-highest on record.

Most of Europe, Asia, South America, eastern Africa, & western North America were much warmer than average, w/record warmth particularly notable in the western United States & eastern Siberia along the Verkhoyansk Range, NOAA said in an analysis.

As for the oceans, record warmth for the 3-month period was notable in the northeastern Pacific Ocean & the southwest Pacific east of Australia, while the North Atlantic between Canada & the United Kingdom was much cooler than average, w/a record cold swath w/in that region.

The unusual warmth in the northeast Pacific has been observed for well over a year, & recent studies show it may be contributing to the record California drought by re-routing weather systems away from the Southwest.

El Niño adding more heat to an overheated climate
El Niño conditions were present during March, which helps boost global average surface temperatures. These conditions are characterized by a broad area of milder-than-average sea-surface temperatures in the tropical Pacific Ocean.

According to the Climate Prediction Center, there is a 70% chance that the El Niño will last through the summer, adding extra heat to an atmosphere that is already warming due in large part to manmade emissions of greenhouse gases, such as carbon dioxide & methane.

There are some signs that the El Niño may be strengthening, based on observed movement of a downwelling pulse of warm water eastward, under the surface of the tropical Pacific. Such pulses are known as Kelvin Waves, & are instrumental in forming & reinforcing El Niño conditions.

The ongoing & quite pronounced Kelvin Wave is already helping to increase sea-surface temperatures in parts of the tropical Pacific, w/temperature anomalies below the surface measured by buoys as high as about 8 degrees Fahrenheit above average. This, plus some observed changes in the atmosphere across the Pacific lends some support to the idea that El Niño may be settling in for an extended stay.

Official forecasts don’t specify the odds that El Niño will be particularly strong. According to Michelle L’Heureux, a scientist w/the Climate Prediction Center, determining the future evolution of El Niño is especially difficult around this time of year. “We’re not ready to take a stab at strength either b/c we believe all strength options (weak to strong) are still on the table & it is still too early to really say,” she told Mashable in an email.

She said the downwelling Kelvin wave could be followed by an upwardly moving pulse of cooler than average ocean waters, which would negate some of the impacts from the warm pulse. “During May through July of last year, an upwelling phase did come in after the downwelling state & temporarily decreased the amount of available heat supply below the ocean,” L’Heureux said. “Right now [emphasis hers] there isn’t a strong indication of that happening again, but it is something to watch for.”

A prolonged or moderate to severe El Niño would significantly increase the already high odds that 2015 will set another all-time global temperature record, as last year did. 9 of the 10 warmest years have occurred since the year 2000, w/13 of the 15 hottest years on record globally all occurring during just the past 15 years, based on NOAA data. The odds of this happening by chance — that is, rather than due to a combination of manmade pollution & natural climate variability — are less than 1-in-27 million, according to the climate research & journalism group Climate Central.

W/out global warming, 1 would expect warm & cold years to occur randomly over that period.

View full article at: http://mashable.com/2015/04/17/earth-warmest-first-quarter/?utm_campaign=Mash-Prod-RSS-Feedburner-All-Partial&utm_cid=Mash-Prod-RSS-Feedburner-All-Partial&utm_medium=feed&utm_source=rss